
Introduction to New Text Slicer feature
What If You Could Filter Your Data in Seconds?
You’re looking at a huge dataset in Power BI, thousands of rows, countless columns. You need to find something specific, like a product name or product ID, but scrolling through endless dropdowns is time-consuming and frustrating.
Here’s the Solution: The Text Slicer!
Forget the dropdowns. Now, you can simply type what you’re searching for, hit Enter, and your visuals instantly update to show exactly what you need. It works even better when paired with other slicer techniques like splitting column values for dynamic slicers to give users layered filtering flexibility.
No more wasted time. No more frustration. Just seamless, lightning-fast filtering that puts you in control. With the Text Slicer, exploring your data has never been easier—or faster!
Text Slicer – Enable and Use with Power BI
Enable Text Slicer in Power BI Desktop
- Open Power BI Desktop and go to the File menu and click on Options and Settings, then select Options. If you’re using Import or Direct Query modes in Power BI, the slicer’s performance may vary slightly, so choose your connection mode based on report size and frequency of data updates.

- Under the Preview Features section, enable the checkbox for the Text Slicer Visual, click OK, and restart Power BI Desktop.
Note:
The Text Slicer feature is currently in Preview Mode in Power BI Desktop! This means it’s not available globally.
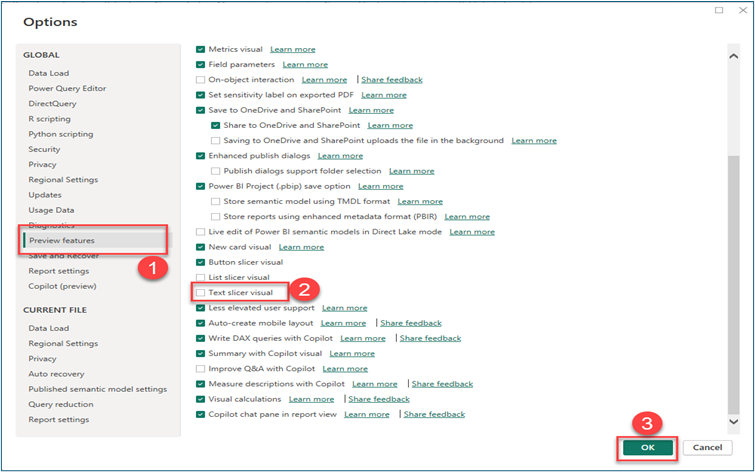
Add the Text Slicer to Your Report
- Open your Power BI report and ensure your dataset is loaded. In the Visualizations pane, locate and select the Text Slicer. The slicer will appear on your report page.
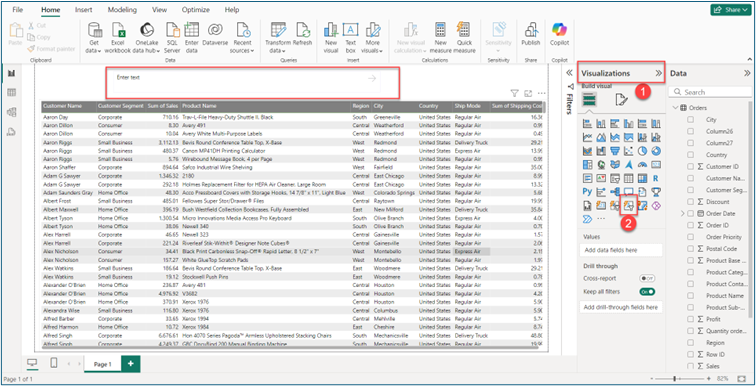
Configure the Text Slicer
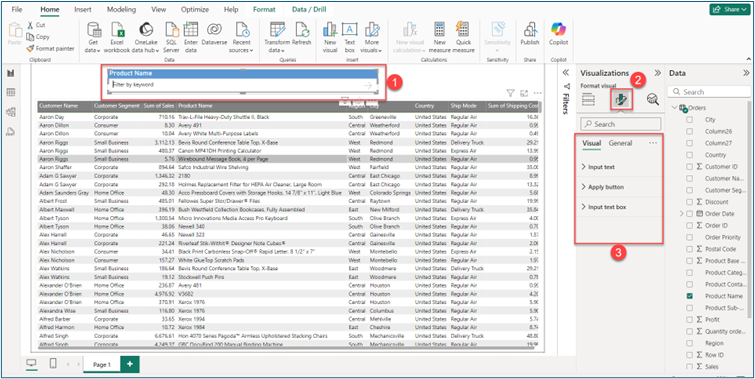
- Add a column or field from the Data pane to the Field property of the Text Slicer.
Example: Add the “Product Name” field for filtering product data.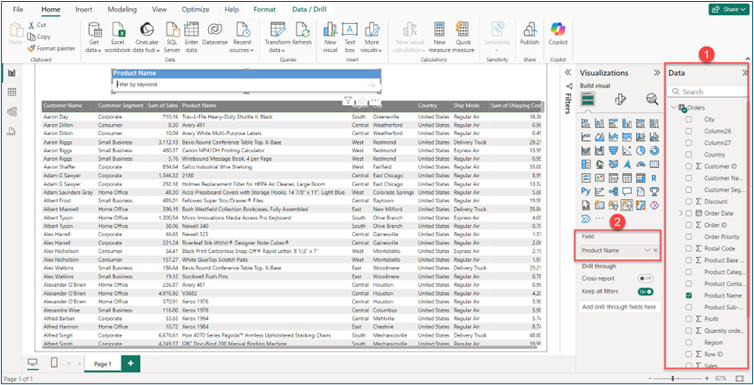
- Use the slicer’s text box to type search terms, and click the arrow () to apply the filter.
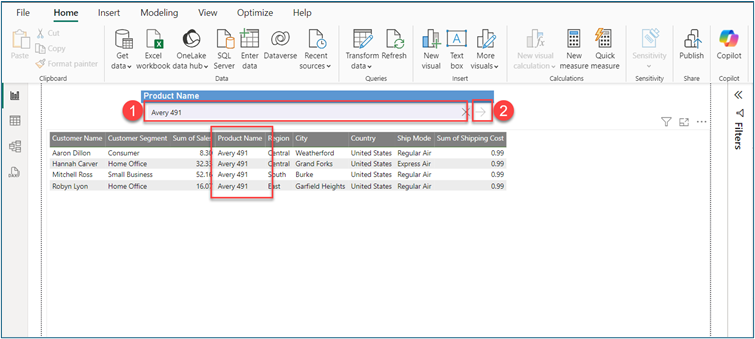
Customize the Text Slicer
- First, select the visual, then go to the Visualization section. Next, select the Format Visual section and modify properties like font size, style for the text box, and more.”
Conclusion
The Text Slicer offers an innovative approach to filtering data in Power BI, making the process faster and more intuitive. It’s also a great enhancement when paired with Row-Level Security to ensure users can only search within data relevant to their access rights. For organizations looking to build interactive, secure, and high-performance dashboards, our Power BI experts can help integrate features like Text Slicer seamlessly into enterprise-grade reporting systems. Its ability to customize and adapt to user needs enhances both the functionality and design of reports. By incorporating this tool, users can achieve more efficient data exploration and create interactive, user-friendly visualizations.
Want to talk?
Drop us a line. We are here to answer your questions 24*7.


