
Have you ever struggled to make your Power BI slicers truly intuitive and effective? Whether you’re optimizing layout with the new Text Slicer or customizing split columns, every interaction matters. Imagine using the Power BI split column feature to effortlessly separate year and month values, allowing you to create dynamic slicers in Power BI that transform how you interact with your reports.
By mastering split columns in Power BI, you can enhance your filtering experience and apply advanced Power BI slicer techniques for seamless data exploration.
Curious to see how it’s done? Let’s jump right into the steps and make your reports smarter!
Load Your Dataset and Add Table Visual
- Begin by loading your dataset into Power BI.
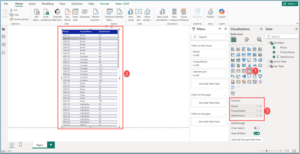
- Once your data is ready, head to the Visualizations section and select Table Visual. Drag and drop the required columns into the table to display your data in a clean, tabular format.
Create Necessary Tables from the Main Table
For Year
- Create a Year Table by entering the following DAX query in the formula bar. This structure helps not just in slicer usability but also in improving query performance, something that becomes even more critical when managing complex data models like Direct Query vs Import modes in Power BI.
Year Table = DISTINCT('MainTable'[Period])
- This will create a Year Table from the Main Table using the Period column.

For Month
- Similarly, create another Month Table by entering the following DAX query in the formula bar:
Month Table = DISTINCT('MainTable'[Period])
- This will create a Month Table from the Main Table using the Period column.

Create a new column in both the Year and Month tables to split the Period column value from the main table.
In Year Table
- Create a column in the Year Table and enter the following DAX query:
Year = RIGHT('Year Table'[Period],4)
- This will create a Year column from the Period column.
![]()
In Month Table
- Similarly, Create a column in the Month Table and enter the following DAX query:
MonthNumber = MID('Month Table'[Period], 4, 2)
- This will create a MonthNumber column from the Period column.

- Next, create another column, MonthName, in the Month Table, and enter the following DAX query:
MonthName = SWITCH(
MID('Month Table'[Period], 4, 2),
"01", "JAN",
"02", "FEB",
"03", "MAR",
"04", "APR",
"05", "MAY",
"06", "JUN",
"07", "JUL",
"08", "AUG",
"09", "SEP",
"10", "OCT",
"11", "NOV",
"12", "DEC"
)
- This will create a MonthName column from the Period column. The MonthName column can be used in slicers, and you can sort it using the MonthNumber column for proper order.

Let’s Add the Hierarchy Slicer Visual
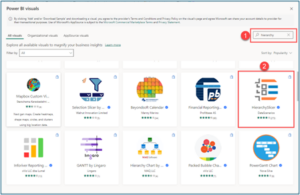
- Add slicer from the Get more visuals.
- In the search bar, type Hierarchy, and you will see Hierarchy Slicer. Click on it.
Add visual to the Power BI Report
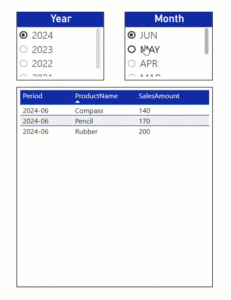
Add slicer for the Year
- Add the HierarchySlicer visual to the Power BI report and select the Year column.

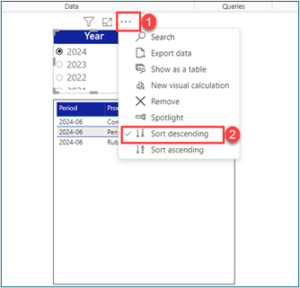
- By default, the years will appear in ascending order. Click on the three dots (…) in the header icons and select Sort Descending.
Add slicer for the Month
- Similarly, add another slicer for the Month and select the MonthName column from the Month Table.
- To arrange the months in the correct order, select the Month visual, then navigate to the Column Tools menu. Choose Sort by Column and click on MonthNumber.
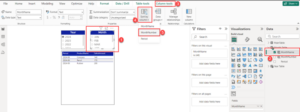
- Finally, sort the months in descending order, just as you did for the year visual.
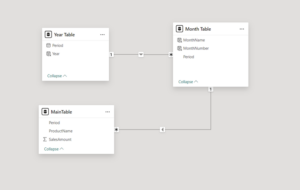
Define Relationships Between Tables
- Establish the following relationships:
- Main Table [Period] → Month Table[Period] (many-to-one relationship, single direction).
- Month Table [Period] → Year Table[Period] (many-to-one relationship, single direction).
Test and Refine Your Slicers
- Interact with the slicers to filter your data dynamically. Confirm that selecting a year or month updates your table visual accurately. And for teams working with sensitive or departmental data, don’t forget to apply Row-Level Security in Power BI to control access appropriately.
Conclusion
By following this straightforward approach, you can significantly enhance the way you filter and analyze your data. Splitting values effectively provides better control over your reports, making the data exploration process more dynamic and insightful. Whether you’re a beginner or looking for expert guidance, leveraging Power BI consulting services can help you unlock even more potential from your reports.
Want to talk?
Drop us a line. We are here to answer your questions 24*7.


